
Nova Analytics
Nova Analytics provides end-to-end analysis of the services and quality perceived by telecommunications operators’ customers…

Nova Analytics provides end-to-end analysis of the services and quality perceived by telecommunications operators’ customers…

Ampercom WiWay é un sistema basato su hardware e software di nostra realizzazione capace di sorvegliare e garantire il funzionamento delle reti Wi-Fi. WiWay é in grado di emulare il comportamento degli utenti sulla rete Wi-Fi e di verificare il livello di servizio percepito durante l’utilizzo dei dati, del video e della voce…

In an ever-changing market, having one more tool to stand out and make more considered choices is of paramount importance.
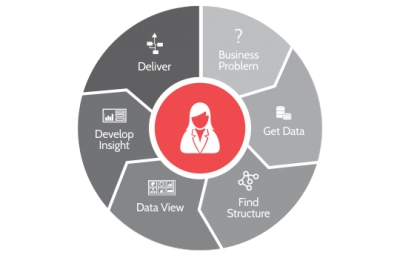
The benefits of introducing Analytics solutions into your company are many…